Service Express • e2
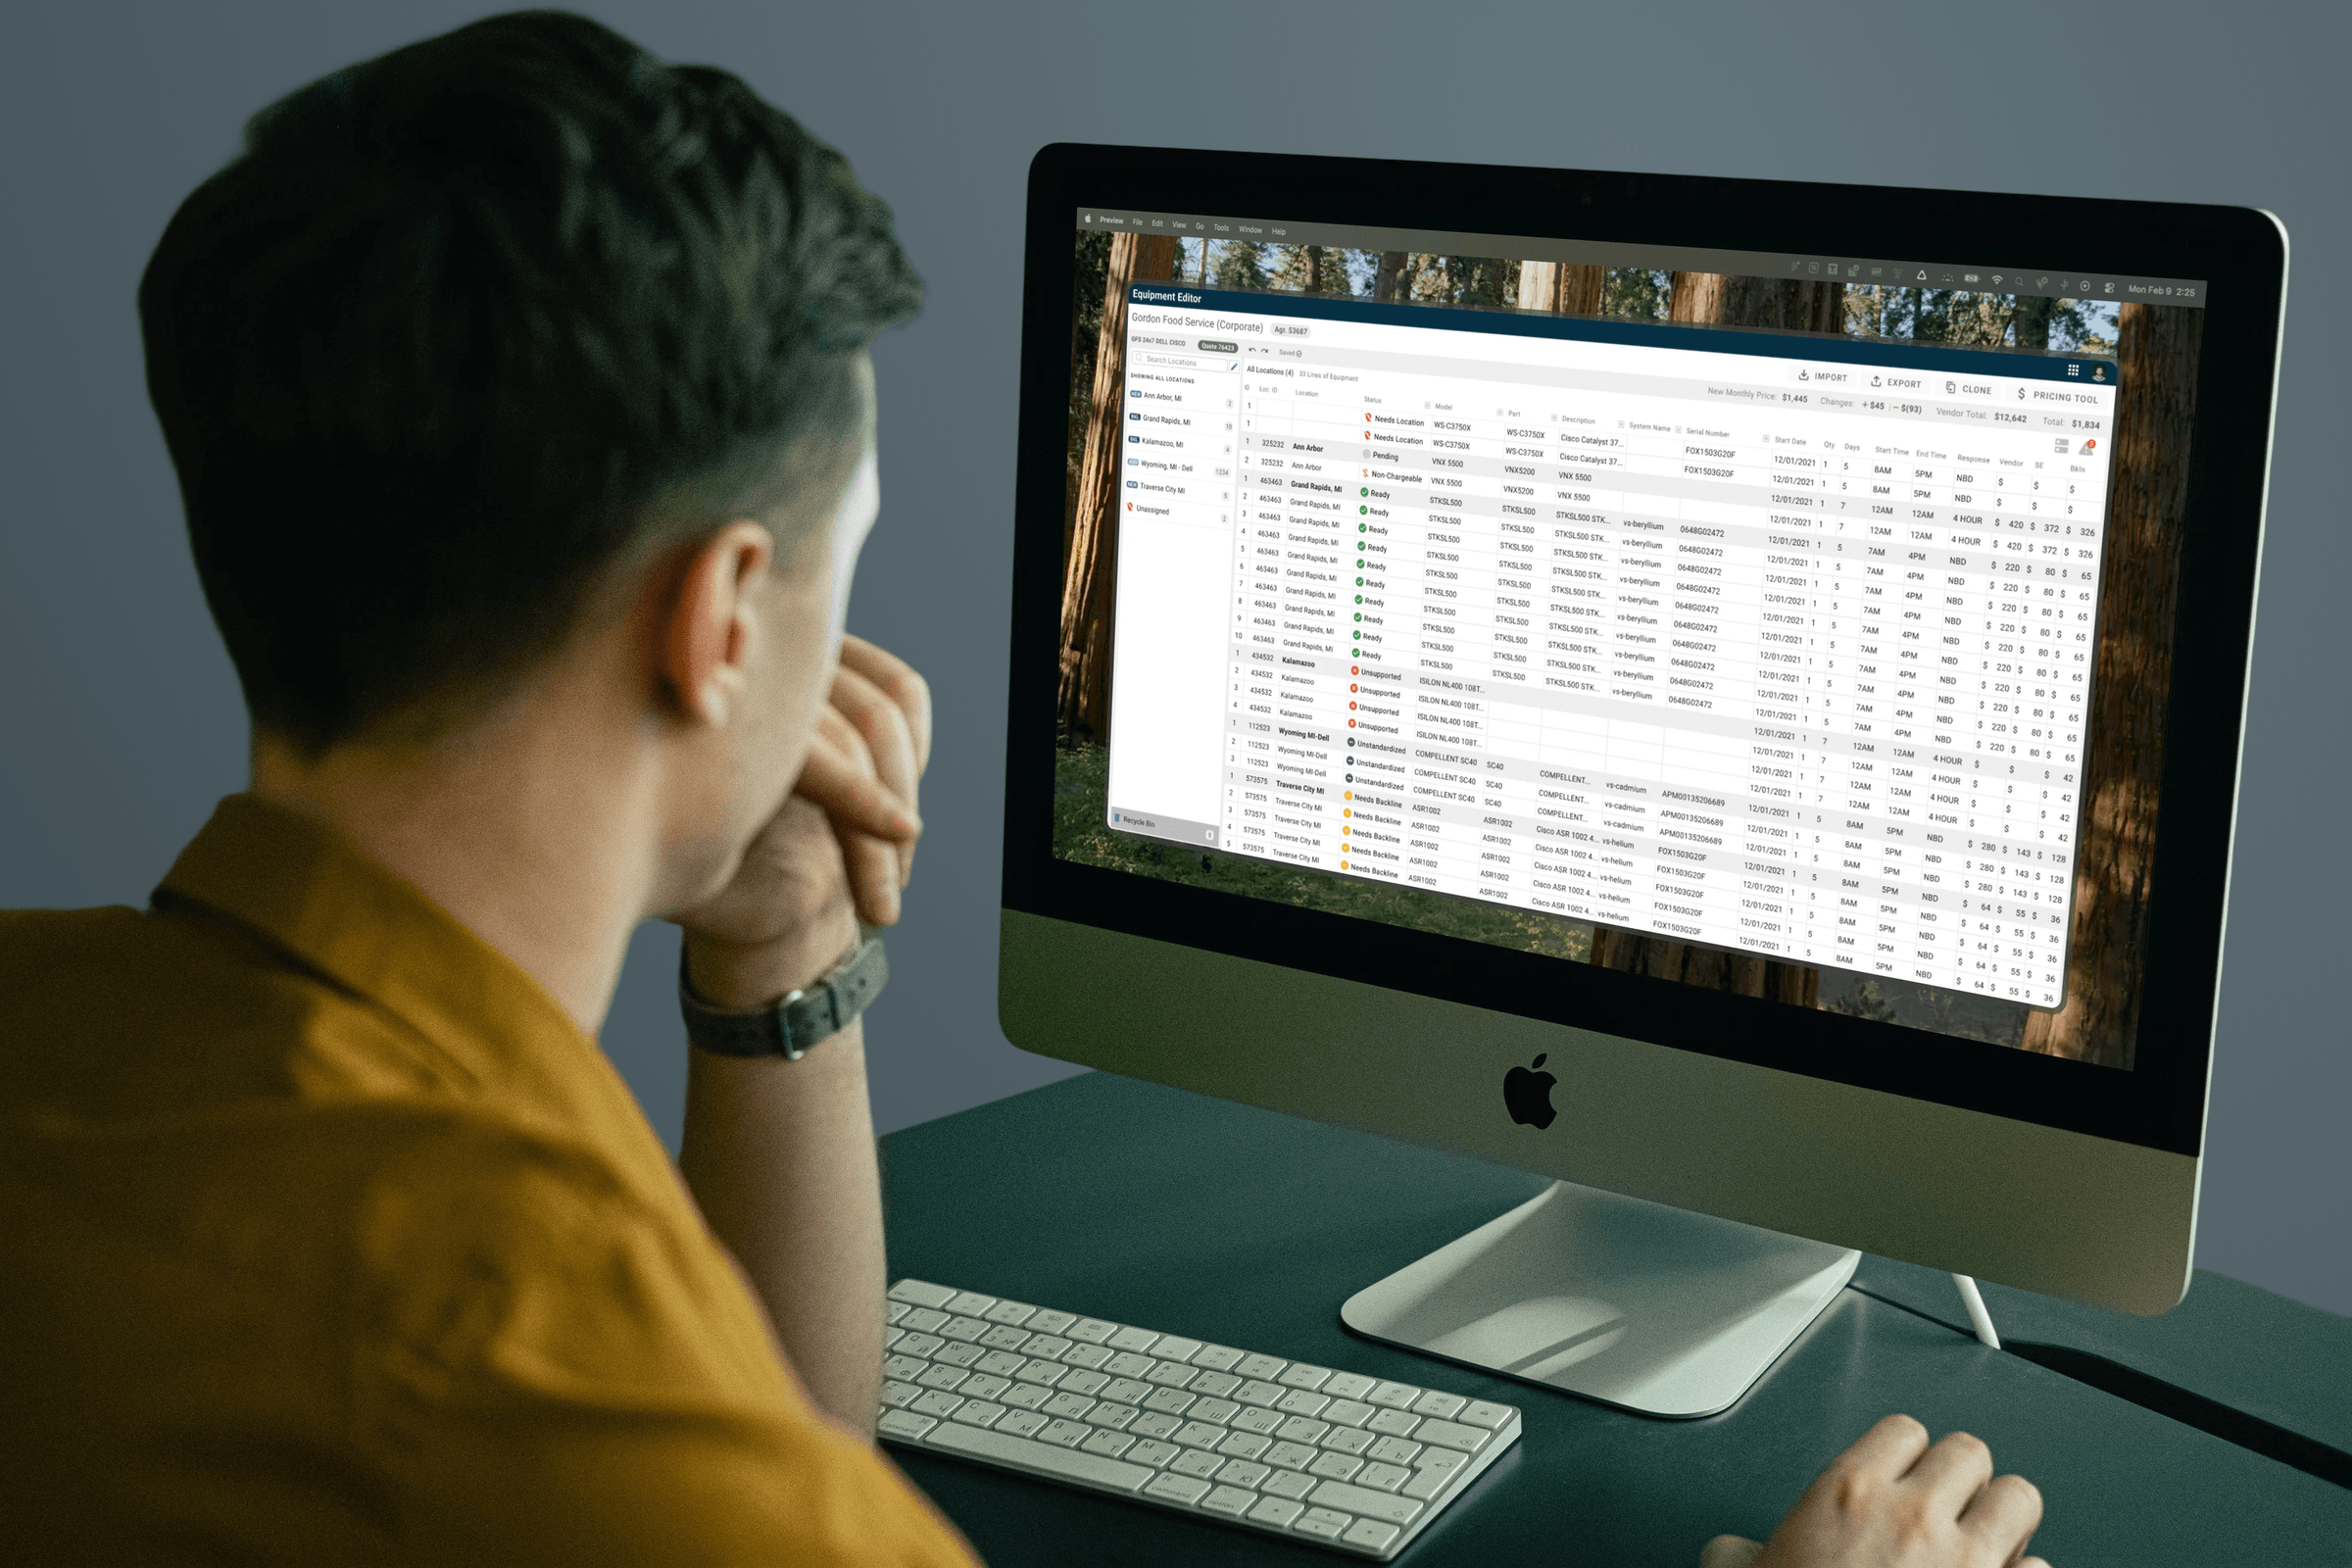
Redesigned a decade-old quoting tool used by 300+ sales reps daily, replacing its one-location-at-a-time workflow with a spreadsheet-style editor that matched how reps actually worked.
The short version
Service Express ran its sales quoting on a tool built more than a decade earlier by a small dev team with no designer involved. Over 300 reps used it every day, roughly 45 minutes per session. I spent 12 months redesigning it. My first real prototype was wrong, and stakeholders told me so directly. The pivot that followed became the whole product: an editor that works like the Excel file it exports. It shipped as e2. New hires who used to need days of shadowing could build a quote on their first day.
What Service Express does
Service Express sells maintenance for data center hardware, the servers and storage other companies run their business on. Sales reps quote that coverage, and the equipment editor was where every one of those quotes got built. It sat right at the front of the sales process.
The legacy editor
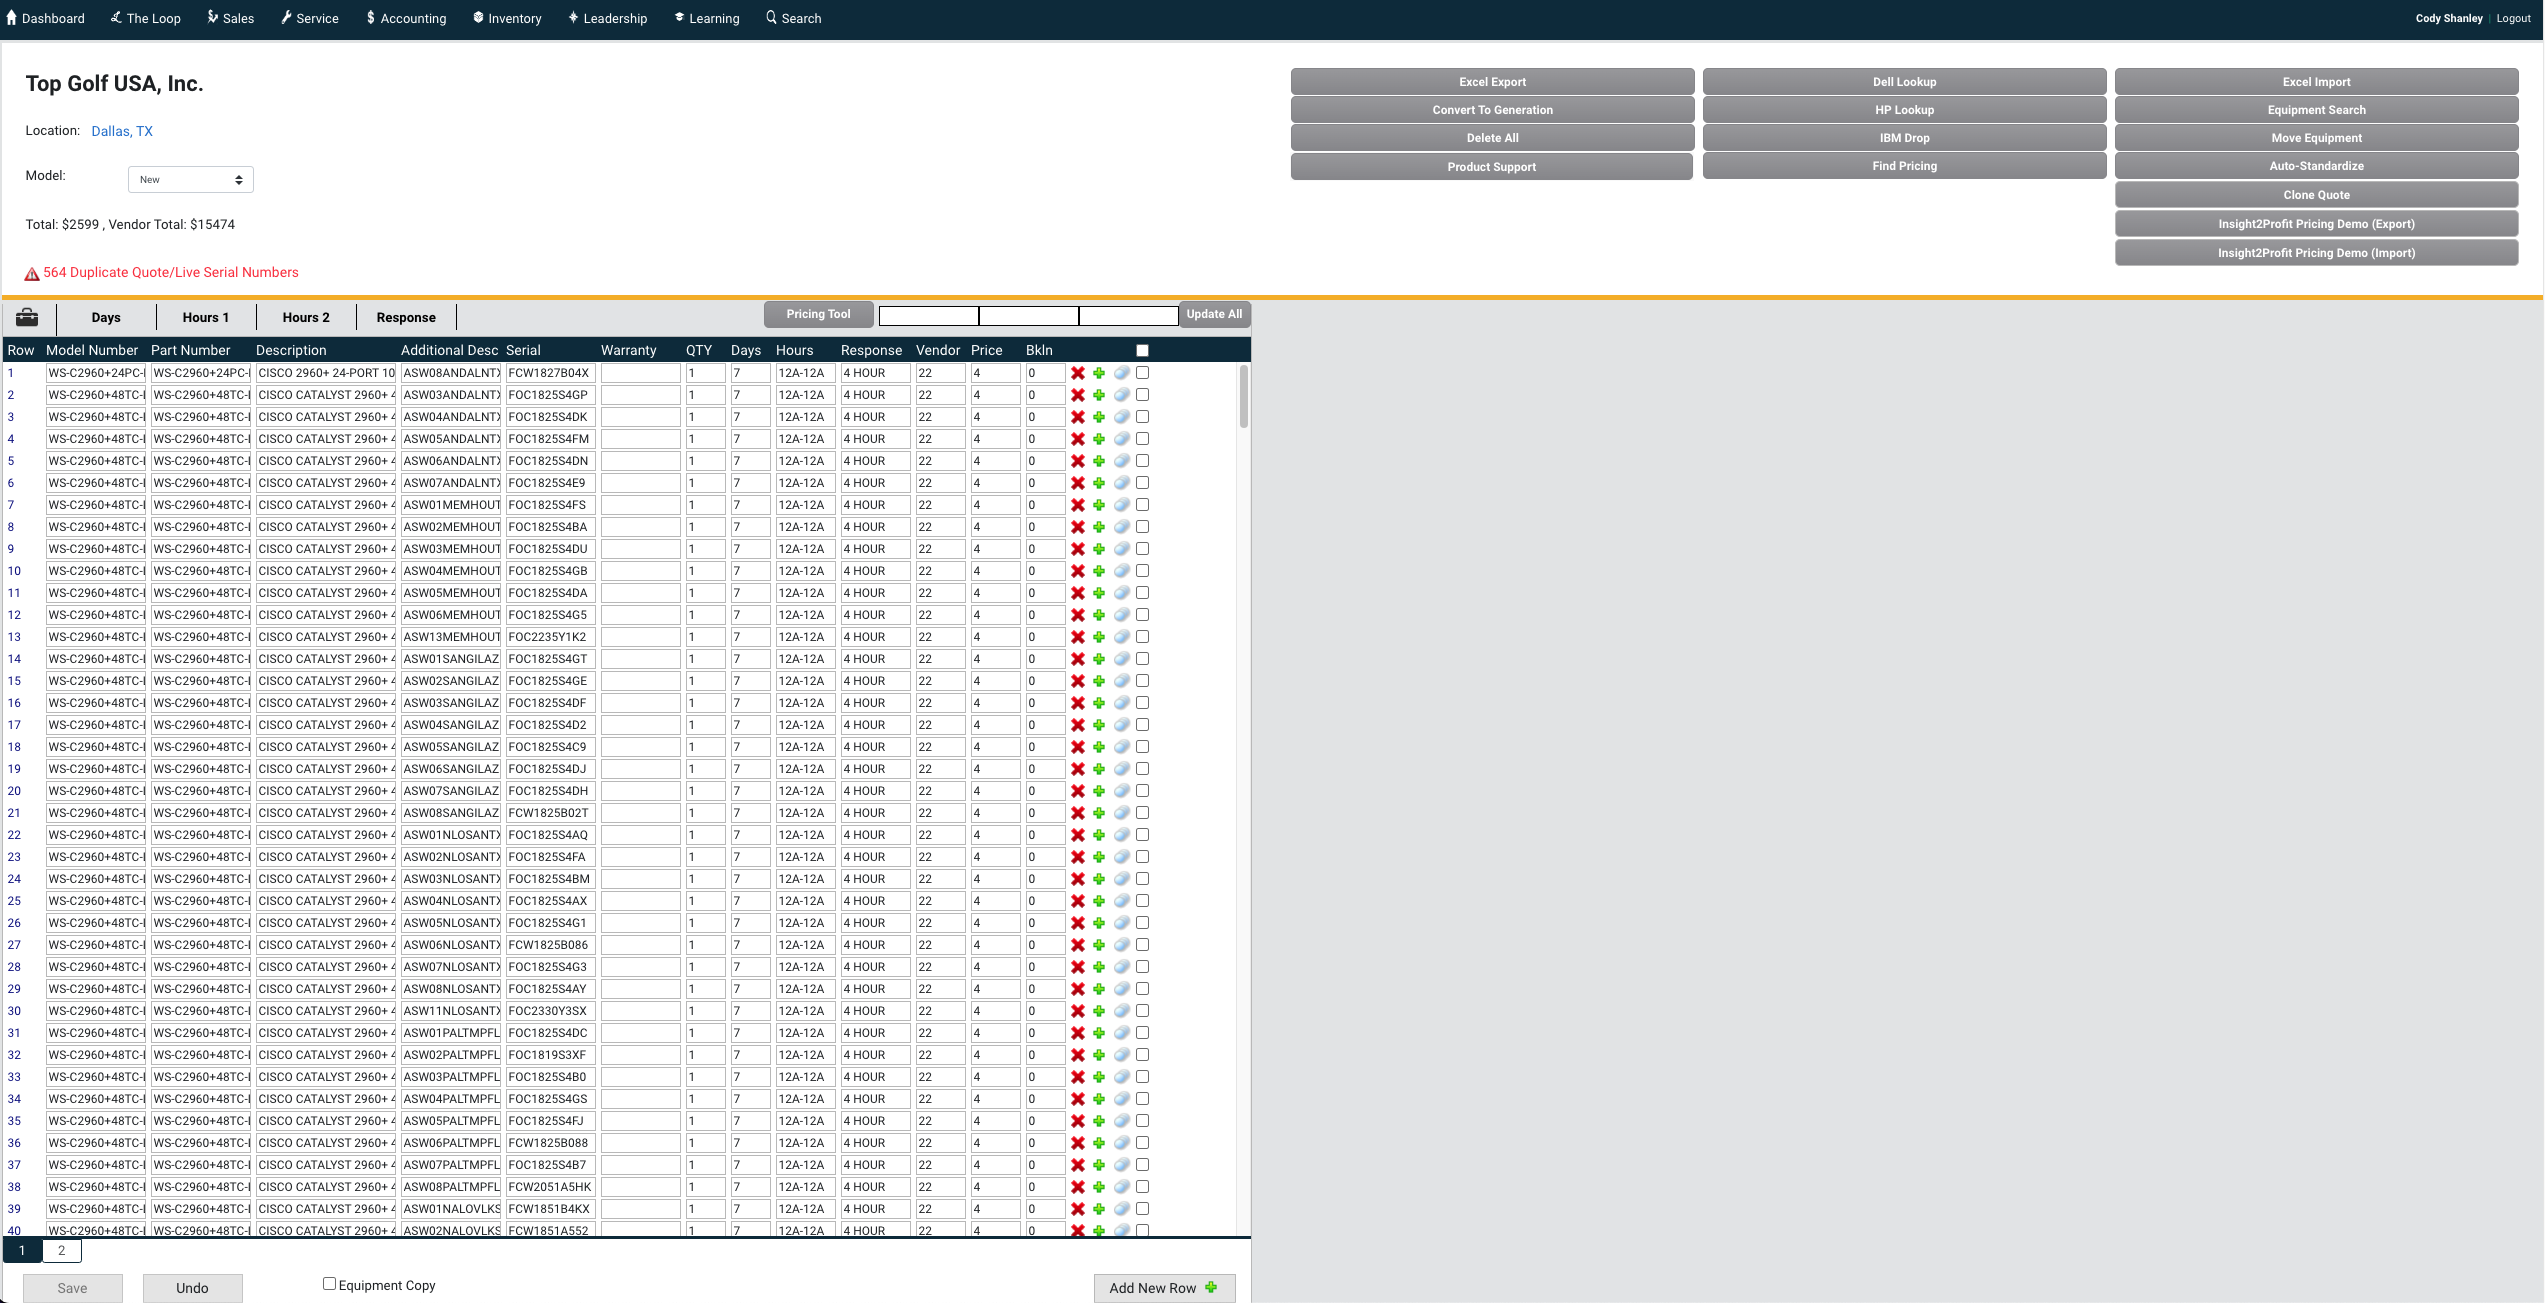
Developers built the original editor years before the company had a design team, and it showed. The workflow was clunky and the interface was dense in the wrong places. Nobody had written down why anything worked the way it did.
With 300+ daily users at 45 minutes a session, shaving a few minutes off each one was worth thousands of hours a year across the team. That math is what justified a year-long redesign.
How people actually worked
I started by sitting with sales reps and watching them quote. Three things stood out.
New hires got hit the hardest. Veterans had built muscle memory around the quirks. Onboarding someone new meant days of shadowing, because there was no path through the tool you could figure out on your own.
Everyone thought in Excel. Reps exported quotes to Excel constantly, sometimes mid-workflow, just to sort or clean up data the editor couldn't handle. Rows and columns were the mental model. Any design that fought that was going to lose.
One location at a time was the bottleneck. The old editor only let you work with a single equipment location at a time. Multi-site quotes meant repeating the same steps over and over. This was the loudest frustration I heard.
The export habit
Watching reps work, the pattern repeated: build part of a quote, export it, fix it in Excel, and keep going from there. The export button was doing the job the editor should have been doing.
"Honestly I just get it into Excel as fast as I can. That's where the real work happens."
The multi-site grind
One rep quoting a customer with a dozen locations walked me through the same sequence of screens twelve times. He had the click pattern memorized. He was not happy about it.
"It's the same screens for every single location. Twelve sites means I do it twelve times."
Paper sketches first
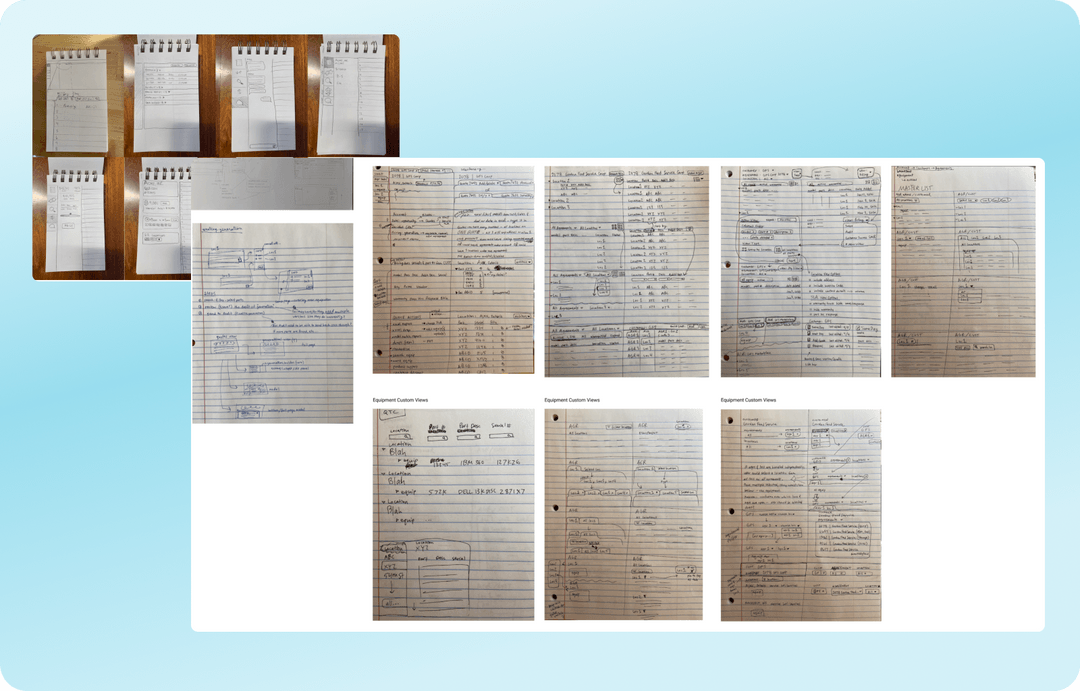
I put pencil sketches in front of stakeholders before opening a design tool. It felt exposed, showing work that rough to the people who sign off on budgets. It was also the most efficient feedback loop of the whole project. People argued with the sketches in a way they never did once things looked finished.
The nested prototype
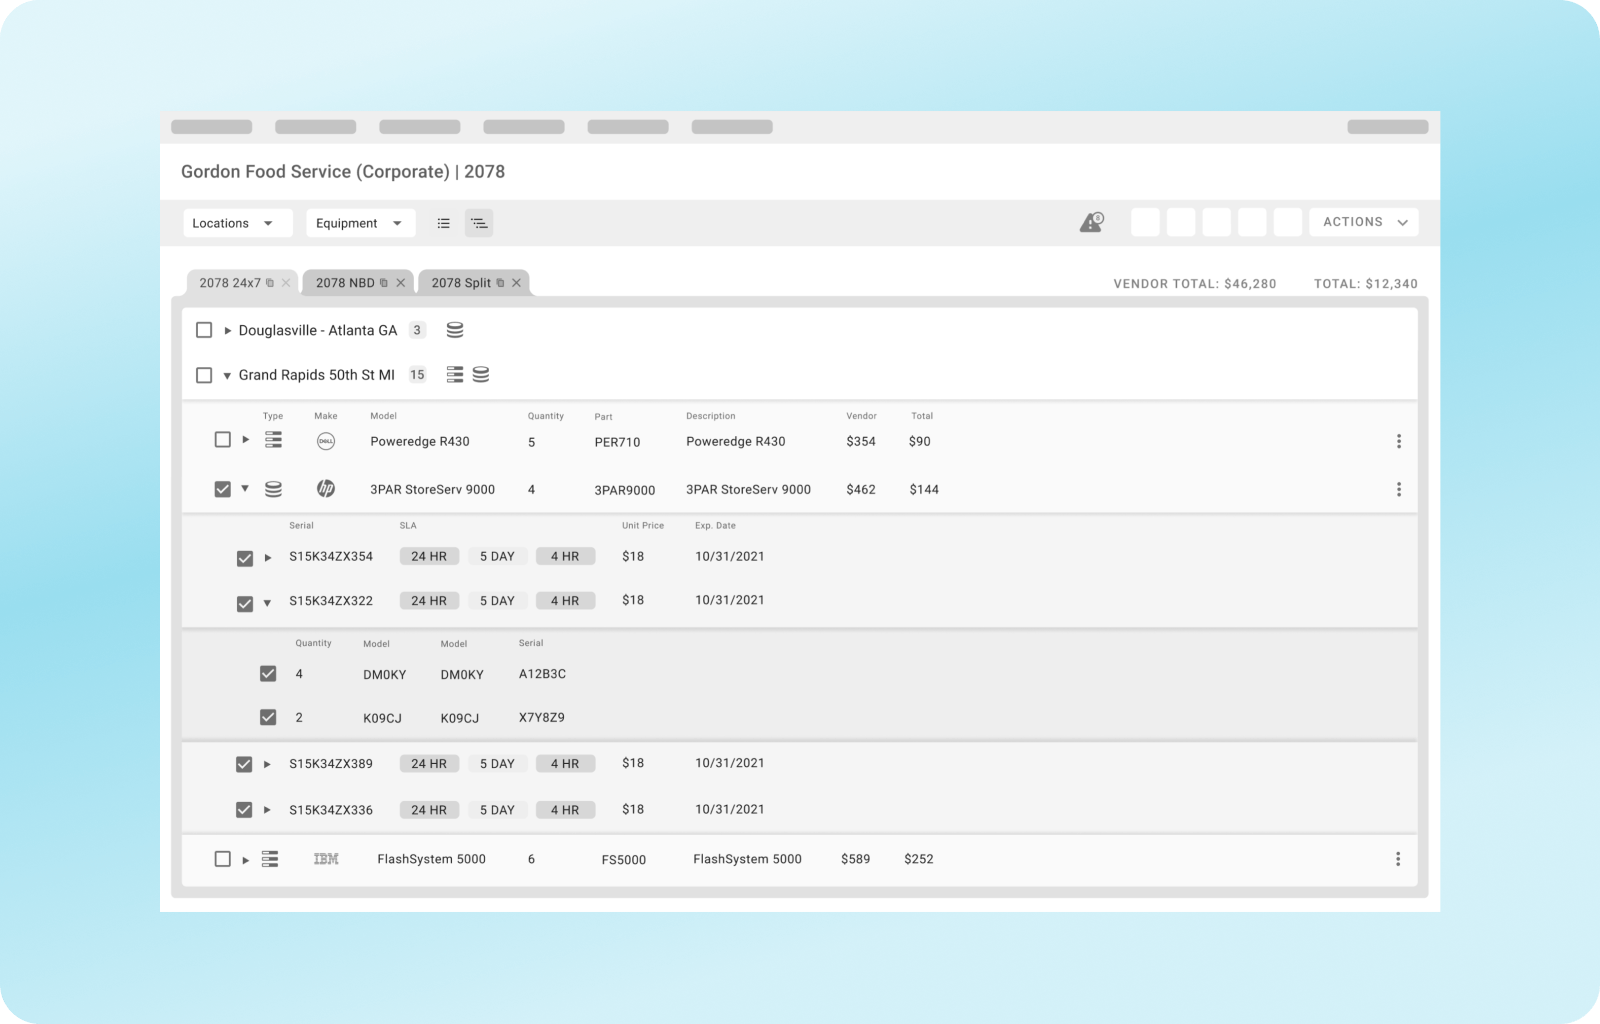
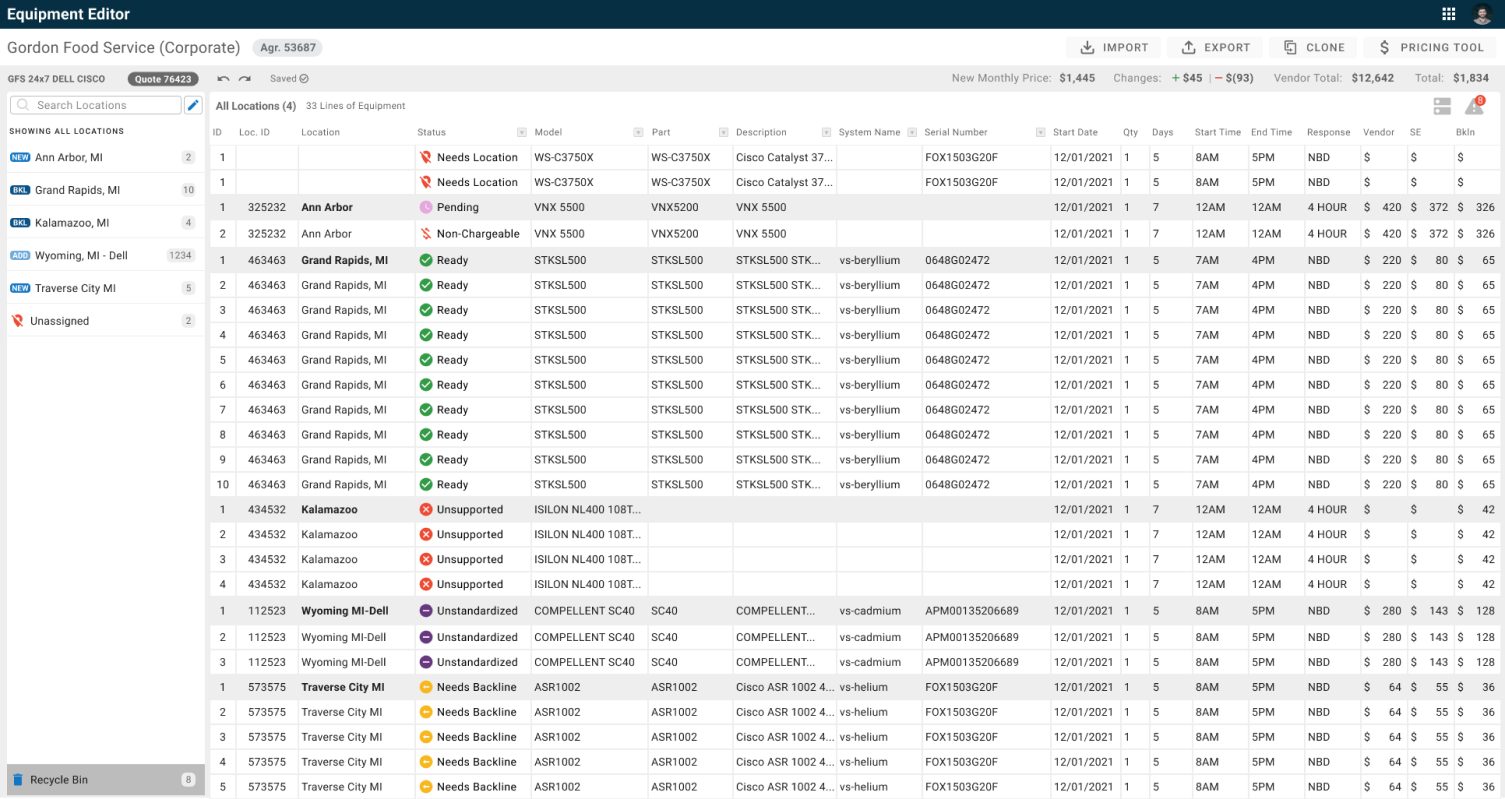
The first real prototype organized the quote the way an information architect would: locations as collapsible groups, open quotes as tabs across the top. It demoed well and the early feedback was decent. I was fairly confident in it.
"We just want Excel"
Then stakeholders pushed back, hard. Every quote ends its life as an Excel export, and they wanted to know why building one should look nothing like that.
My first instinct was to defend the hierarchy. It was cleaner information design, and I had the diagrams to prove it. But the evidence against me was already sitting in my own research notes. Reps exported to Excel mid-workflow because the tool wouldn't let them work in rows and columns. The structure they wanted already existed. It was the spreadsheet.
Fair point. We scrapped the nested view and pivoted to a spreadsheet-style layout.
In the moment, it felt like throwing away a month of work to build a spreadsheet, which is the thing designers are supposedly hired to save people from. It took a week or so of sitting with it to see what the pivot actually was. Making a browser table genuinely behave like Excel, inside a real quoting workflow, was more design work than the hierarchy ever was.
Picking the table
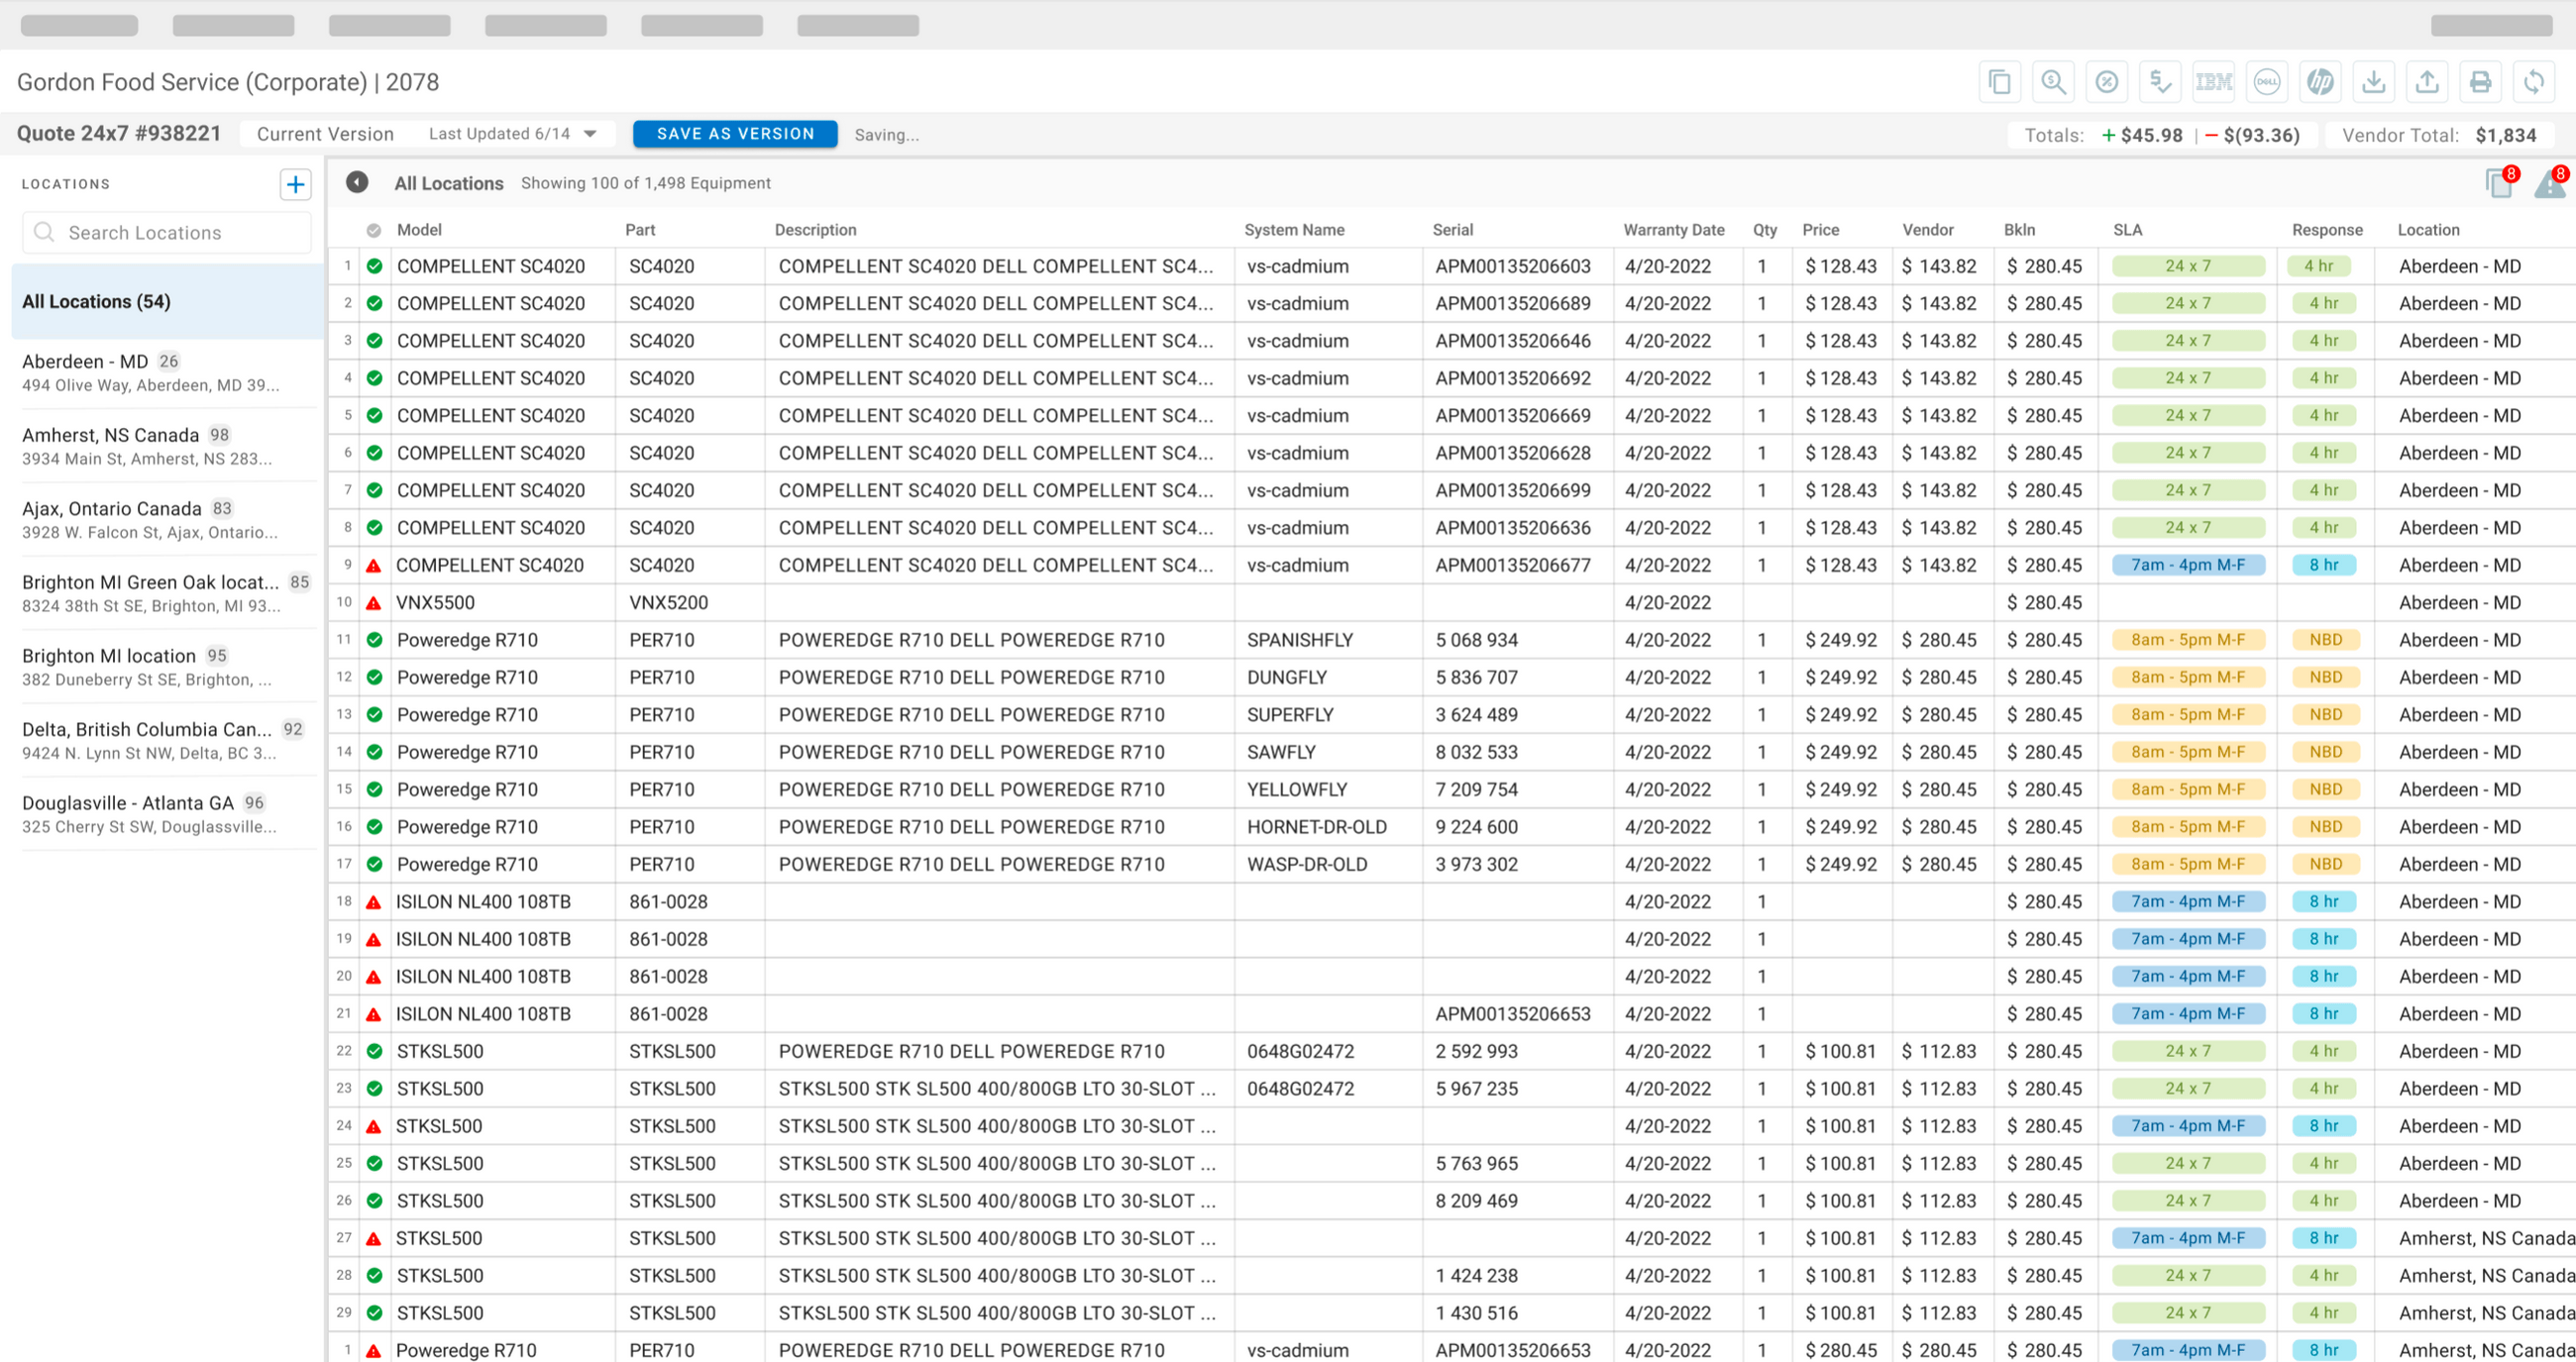
Once the direction was a spreadsheet, the table stopped being a component and became the product. It had to genuinely behave like Excel in a browser: sorting, filtering, inline editing, multi-select. I partnered with engineering to figure out how to get there, and we looked seriously at three paths.
Build it ourselves
Total control over interaction and styling, and no license fees. But engineering estimated months of work just to reach parity with what grid libraries ship out of the box, before we built anything specific to quoting. Every keyboard edge case would be ours to find.
AG Grid
Real spreadsheet behavior on day one: inline editing, multi-select, sorting and filtering at scale. The costs were a license fee and an opinionated component we'd be styling around for years.
React Table
Free, clean, easy to theme. But it was built to display data, with editing as an afterthought. Making it behave like Excel would mean rebuilding half of what the commercial grid already did.
We settled it with a bake-off. Engineering wired the two library candidates up to a copy of one of the biggest real quotes in the system, a customer with dozens of locations and a few thousand line items, and we watched what broke. React Table stuttered on inline editing at that scale. AG Grid didn't blink. The license fee was hard to swallow at first, but next to months of building table internals ourselves it was a rounding error. We adopted the grid and spent the saved effort on everything around it.

The final design
Two features defined the shipped product.
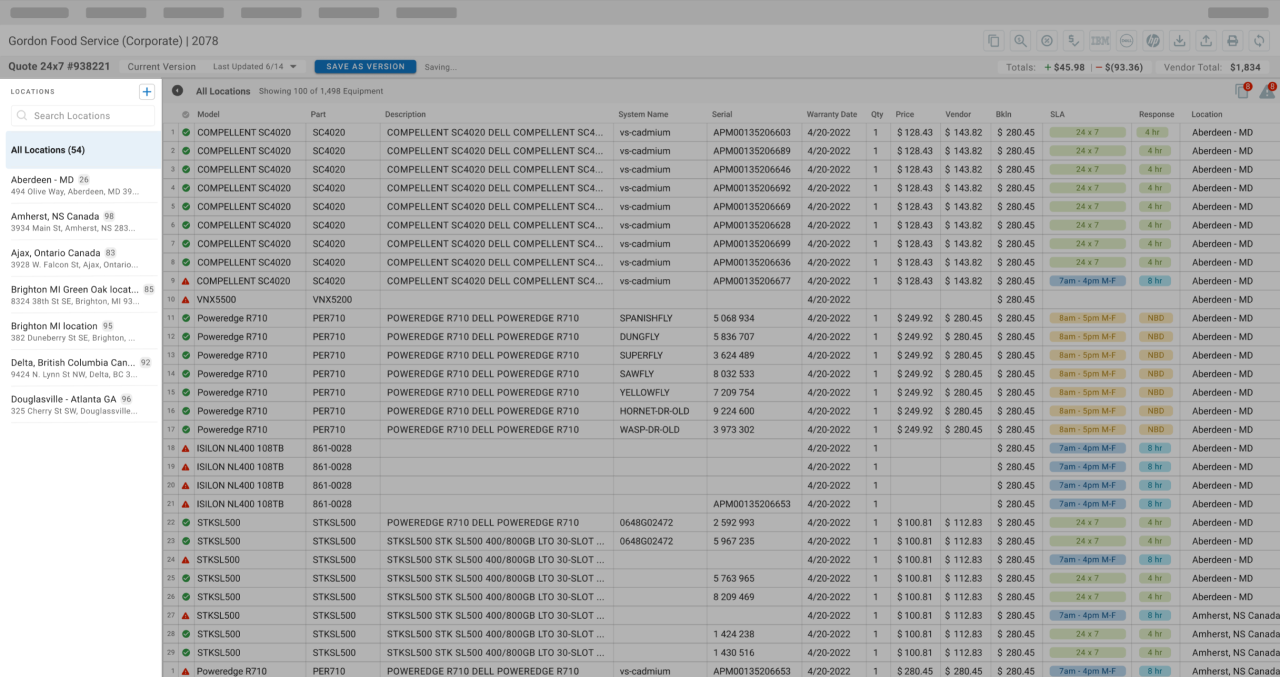
The locations sidebar lets reps filter and select multiple equipment locations at once. This killed the one-location-at-a-time constraint, the most common complaint I heard in research. It was the first thing reps asked about in demos.
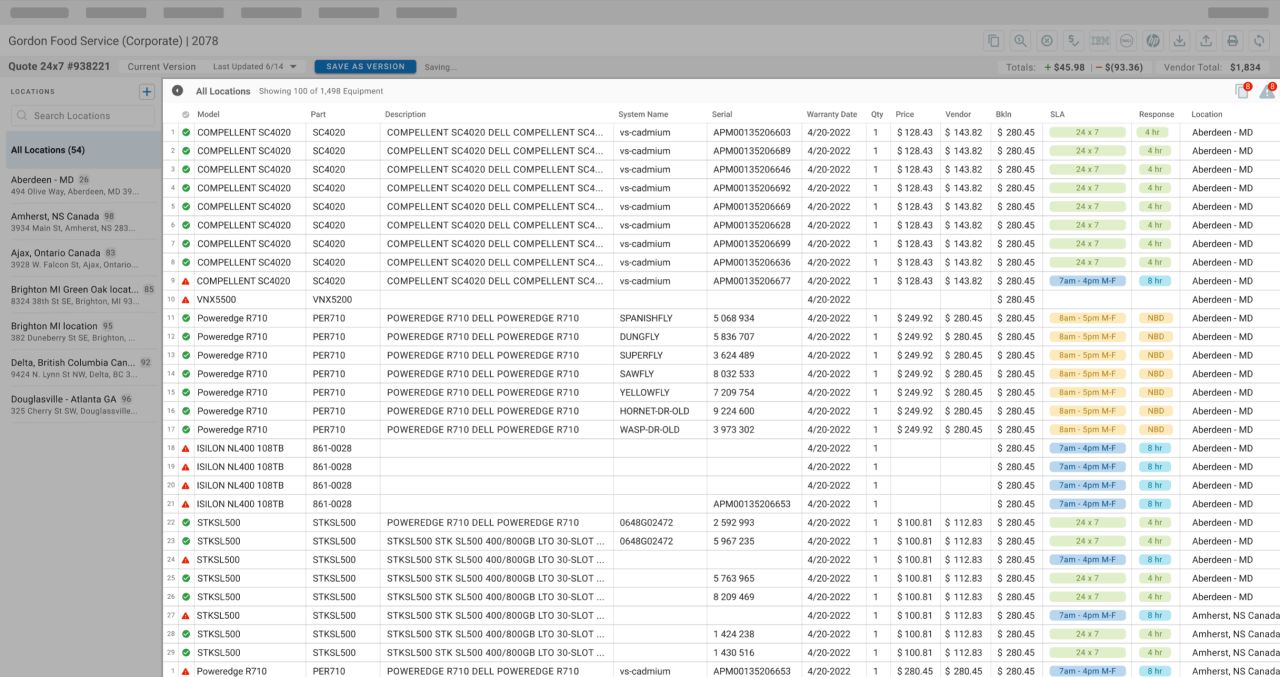
The equipment table brought actual spreadsheet behavior into the browser: sort, filter, edit inline, select across rows. Not a display grid with an edit modal bolted on. The work reps kept leaving the tool to do in Excel, they could now do in place.
Rollout was not smooth
The pilot pushed back. We released e2 to a small pilot group before the full rollout, mostly veteran reps, on the theory that if the power users bought in, everyone else would follow. The first feedback session stung. One senior rep, a decade on the old tool, told me the new editor was "nicer to look at and slower to use." He wasn't being difficult. Ten years of muscle memory is a real asset, and we had just deleted his.
The numbers agreed with him. For the first couple of weeks, the pilot backed him up. A few veterans quietly went back to the legacy editor when a deadline was close, which is the most damning feedback there is. New tools get evaluated in the worst possible conditions, when someone is under pressure, and ours was losing those moments.
The real complaint was the keyboard. These were Excel people. They lived on Tab, Enter, and the arrow keys, and our first build was mouse-first: click a cell, click to confirm, click the next cell. We added full keyboard navigation between cells, Enter to commit and move down, and paste support for filling ranges. Roughly two weeks of engineering work, and it flipped the room. The same rep who called e2 slower started walking newer pilot users through it without being asked.
Nobody in months of interviews ever said the word "keyboard." They didn't know it was a preference. It was just how their hands worked after ten years in Excel, and I only caught it because a release forced it into the open.

Results
The redesigned editor shipped to all 300+ daily users as e2.
I don't have clean before-and-after numbers on quote time. What I have is what I could watch after launch. New hires could build a quote on their first day with little hand-holding, down from days of shadowing on the legacy tool. And the mid-workflow Excel exports stopped showing up, at least in every session I sat in on.
What I learned
The evidence beat my architecture, and I had the evidence first. The nested hierarchy was better information design on paper. But the people using this tool 45 minutes a day thought in rows and columns, and I had already watched them export to Excel mid-workflow to prove it. I treated those exports as a symptom to fix instead of an answer to copy. The stakeholders were right to push back, and I should have caught it myself in the shadowing sessions instead of needing the meeting.
Watch hands, not complaints. Nobody mentioned the keyboard in interviews because it wasn't an opinion, it was a habit. If I had watched veterans' hands during the shadowing sessions instead of mostly listening to their complaints, keyboard-first editing would have been in the first build instead of patched in after the pilot.
Show rough work early. Pencil sketches in front of stakeholders felt risky and turned out to be the cheapest alignment tool on the project. People reacted more honestly to something that obviously wasn't finished. By the time we showed polished mocks, the big arguments were already over.